


How a routine autovacuum on a high-traffic Postgres table flipped a query from 1.3ms to 5 seconds and pegged our Aurora reader at 100% CPU. A walkthrough.
A quiet Monday morning. A little too quiet for our liking. The reason it was quiet; 2xx codes dropped on our creator profile endpoint. The product was quiet but the alarms had gone berserk.
Time to figure out what broke!!!
The first weird thing was HPA. Despite climbing traffic, it was not scaling our pods. Pods were restarting instead of staying up. Liveness probes were failing on high latency, and each restart kept CPU from building up long enough to trip the autoscaler. So the autoscaler sat there watching throughput collapse while pod CPU stayed flat in its band.
We went one layer down. The latency traced to one endpoint, the profile-read path served on every app open, which makes it among the highest-QPS endpoints we run. On the database side, one query was eating most active sessions on the Aurora reader. The writer was fine. The reader was burning. The query itself had not been touched in weeks.
So why now?
The Database wait-event timeline answered that. A routine autovacuum on our products table had finished early that morning, and the query started failing the moment it completed.
VACUUM is Postgres’s garbage collection: it reclaims space from dead tuples and refreshes table-level metadata in pg_class. Autovacuum runs it when dead-tuple count crosses a threshold tied to table size.
Which raised a stranger question. How does a vacuum on the writer break a read query on the reader?
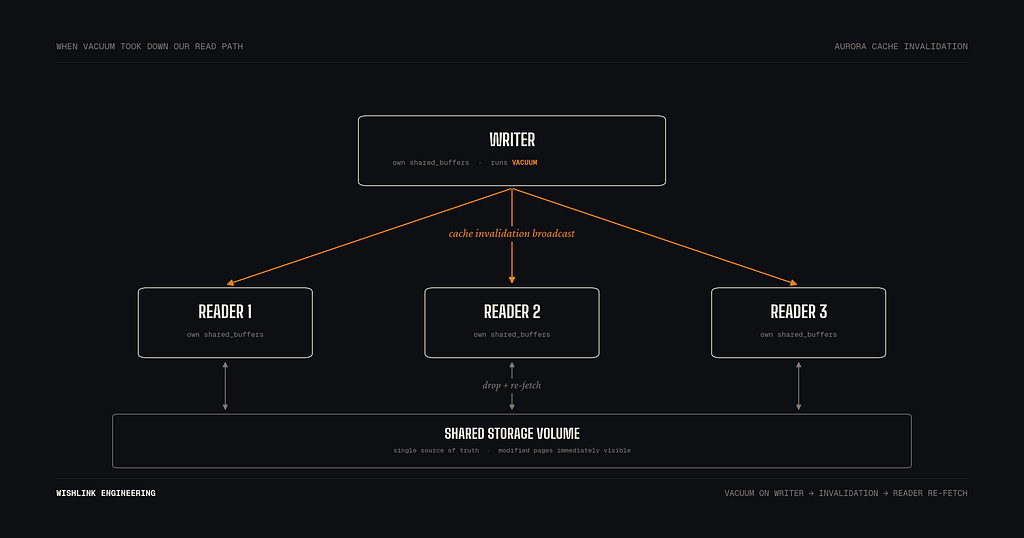
Why the writer’s vacuum reached the reader
Aurora’s writer and readers share underlying storage, but each instance keeps its own shared_buffers in memory. When the writer modifies a page, it broadcasts a cache-invalidation message, and the readers drop those specific pages from their buffer pool. The next read fetches the fresh page from shared storage. pg_class is cached on each reader like any other table; those invalidation broadcasts are what keep it consistent across the cluster.
VACUUM had modified a lot of pages on our products table, including the pg_class row holding the table’s reltuples. Every reader invalidated its cached copies.
A Postgres plan is what the planner picks for a query, scored by a cost model fed from pg_class and pg_statistic. Plans are built per backend when the plan cache misses, then cached in private memory.
Plans, though, are not cached in shared_buffers. They live in per-backend private memory. As reader backends cycled through queries after VACUUM, their plan caches missed and they re-planned against the fresh pg_class values. Each backend on each reader independently converged to the same new plan, because they all read the same updated stats. The plan had a lower estimated cost but a catastrophically worse runtime.
So reltuples had moved. We checked what else might have changed and the answer was: not much. Most planner statistics live in pg_statistic, and only ANALYZE writes there.
ANALYZE samples about 30,000 rows from a table (specifically 300 × default_statistics_target) and extrapolates to refresh planner statistics. Auto-ANALYZE runs on its own threshold, independent of VACUUM’s.
Auto-VACUUM and auto-ANALYZE have separate trigger thresholds; one does not imply the other. There were no ANALYZE log entries near the incident.
What VACUUM did update was three things:
- pg_class.reltuples: exact live-tuple count from its scan.
- pg_class.relpages: current page count.
- pg_stat_user_tables.n_dead_tup: reset to zero.
Of these, reltuples is the only one the planner actually reads when costing a query. It is what tipped us.
How a 5% shift in cost flipped the plan
For the subquery counting a creator’s items, Postgres estimates rows roughly like this:
estimated_rows ≈ reltuples(<product_table>)
               × selectivity(creator_id)
               × selectivity(<status_flag>)
The selectivity terms come from pg_statistic and stayed put. Only reltuples moved.
Here is the part worth sitting with. The bad plan’s cost has always been around 10,162. That number is stable across stats changes because the bad plan is dominated by the creator-table scan, not the products one. It does not move when <product_table>’s reltuples moves. The good plan is the opposite: its cost is dominated by the products-table scan, so it tracks reltuples linearly. Before the incident, that cost sat comfortably under 10,162 and the planner picked the good plan.
Then VACUUM ran. It wrote reltuples to the exact live-tuple count on disk, which had drifted above the stale value the planner was using. The good plan’s <product_table> scan cost rose to 10,688.89 (rows estimate 2,835), and the good plan’s total came to about 10,726. Now the bad plan won by 564 cost units. The planner switched.
We ran ANALYZE. It rewrites reltuples based on extrapolation from its sample, not a full scan. Different runs pull different random samples and therefore produce different estimates. This particular sample landed on a lower estimate than the exact count VACUUM had written. The good plan’s scan cost dropped to 9,231.04 (rows estimate 2,468), its total came in at 9,265, and the good plan won again, this time by 900.
We did not get fixed by that ANALYZE. We got lucky on a sample.
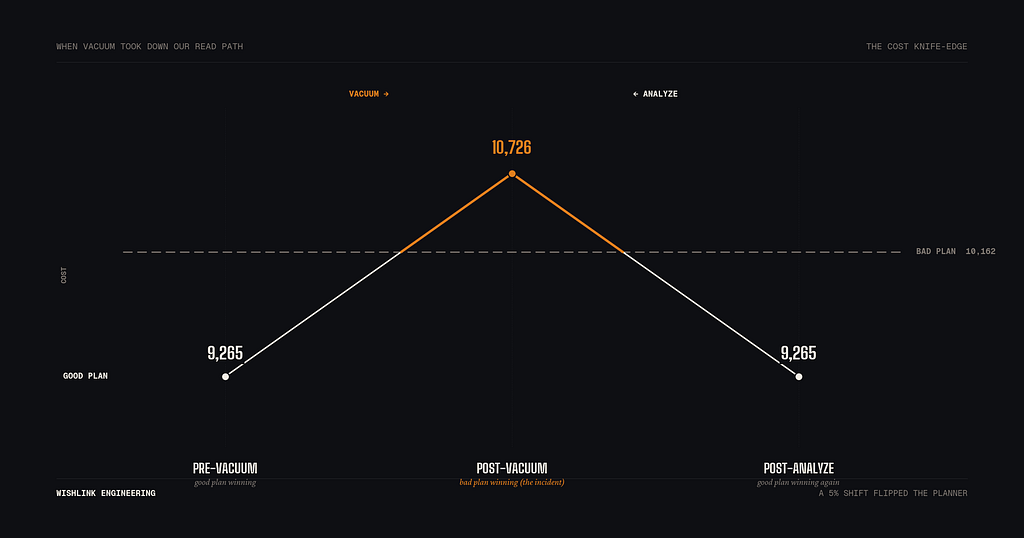
Two cost margins of a few hundred units. That is all that stood between us and an outage. The runtime side, when the bad plan was actually executing, was uglier. The plan’s primary-key walk assumed it would terminate after consuming 2.5% of its input. The creator we were looking up sat 98% of the way through primary-key order, so the fast-start never fired. The scan walked 1.25 million rows to find one row. Latency went from 1.3 ms to about 5,000 ms.
Why this might still happen again
That is the headline, but the more uncomfortable part is what comes after.
Our system has been sitting on a cost-comparison knife-edge for months. The good plan and the bad plan have costs within a few hundred units of each other. Stats changes of that magnitude happen routinely.
Both VACUUM and ANALYZE refresh reltuples, but in different ways. VACUUM writes the exact count of live tuples observed during its scan. ANALYZE writes a sample-based estimate. Both run on their own automatic schedules, on triggers that depend on table churn. Either one can move us across the boundary, in either direction.
The plan flipped back to good this time because an ANALYZE sample happened to underestimate reltuples. The system did not get fixed. It got lucky. The next VACUUM, or the next ANALYZE with an unlucky sample, can push it right back.
What we are changing
We are fixing the query. The rewrite eliminates the bad plan from the planner’s option set, so future stats shifts cannot reach for it. We are keeping the exact form internal.
But the more durable lesson sits one layer up.
The random_page_cost lesson
Every Postgres plan has a cost made of CPU work plus I/O work. The I/O part is driven by two parameters: seq_page_cost (default 1.0) for pages fetched in sequence, and random_page_cost (default 4.0) for pages fetched out of order. A scan’s I/O cost is roughly:
io_cost ≈ pages_fetched_sequentially × seq_page_cost
        + pages_fetched_randomly × random_page_cost
For an index scan touching rows scattered across the table, every heap fetch counts as random. An index scan touching 10,000 such rows costs 10,000 × 4 = 40,000 for I/O alone, while a sequential scan over 10,000 pages costs 10,000 × 1 = 10,000. At the default, the planner is heavily biased toward sequential strategies.
In our case, the bad plan walks the creator table’s primary key in physical order, which the planner reads as cheap sequential access. The good plan uses the username index to find one creator, then nested-loops into the products table, all of which counts as random access. The 4.0 penalty on those random fetches is what narrowed the margin between the two plans to a few hundred cost units, putting us on the knife-edge.
The 4.0 default is a 2005 heuristic for spinning disks, where mechanical seek made random reads genuinely 4–10x more expensive than sequential ones. Aurora’s storage is a distributed network volume with no seek time. Sequential and random reads have effectively the same latency.
Setting random_page_cost = 1.1 (just barely above seq_page_cost = 1.0) reflects the storage we actually have. It keeps a slight preference for sequential access where the planner has a real choice, but it stops penalizing index scans and nested loops that legitimately need random fetches. For us, this widens the margin between the good plan and the bad plan from a few hundred to a few thousand cost units. The knife-edge becomes a buffer.
If you run Aurora Postgres
VACUUM can change query plans without ANALYZE ever running. last_autoanalyze is not the only timestamp that matters when you are debugging a plan flip.
Watch for bimodal latency in pg_stat_statements. When stddev_exec_time is much larger than mean_exec_time on a high-QPS query, that is the signature of plans flipping on a cost boundary.
The default random_page_cost = 4.0 is wrong on Aurora. Tune it.
Nothing was broken that morning. The planner did what its cost model said. VACUUM did what VACUUM does. The autoscaler did what we configured it to do. The system had been one ordinary maintenance event away from this for months. We just had not been hit yet.
Manav Rao — Tech Lead, Wishlink