

Part 2: Building the Fortress — From Manual Mishaps to Automated Workflows

We had just pulled back the curtain on the monstrous beast that was our reconciliation process — bloated data, tight timelines, edge cases, and chaos at every corner. Now comes the real challenge: how do you build a system strong enough to tame that beast — without losing your mind or compromising system performance?
It had to be scalable, resilient, and secure. A system that could handle complexity without becoming a single point of failure, and one that earned back the trust of creators, brands, and our own sleep schedules.
From Firefighting to Foundations
When I took charge, the existing setup was basically two people manually cleaning data and running scripts directly on production environments. The giant files would hog memory, sending the servers into fits of rage and crashing the whole system. Not exactly the picture of a rock-solid platform.
The first obvious fix? Stop running massive data processing pipelines on production environments. We needed a system that could handle the volume without melting servers or giving our CTO panic attacks.
Step 1: The Admin Panel — Because Manual Uploads Need Some Order
We threw together an admin panel for brand POCs to upload their reconciliation sheets directly in a controlled format. This was a game changer:
- File validation: The system would check if all the rows of the uploaded files matched the expected format before accepting them. No more mystery files crashing the pipeline mid-processing at 11 PM on 31st.
- Tracking: We could track who uploaded what, when, and for which brand. And who did not follow the guidelines of file uploads. Accountability FTW.
- Cleaned on upload: Basic cleaning and validation happened right away, so garbage didn’t pile up.
This took a huge load off the tech team’s backs and gave brand POCs (Brand side Point of contacts) visibility and control.

Step 2: The Staging Table — A Safe Sandbox for Dirty Data
Next, we set up a staging layer — think of it as a quarantine zone where raw data could be safely inspected and processed before it touched the production systems that creators and finance depend on.
Why does this matter? Because reconciliation data is rarely neat or reliable. Orders can be returned, partially refunded, or canceled. Sometimes, the brand simply sends the wrong numbers. The staging layer became our buffer against this chaos. It allowed us to:
- Create negative entries for returns or cancellations without polluting live data — so we could compare against production records and debug issues without showing incorrect numbers to brands.
- Process uploads in batches to prevent memory overload.

- Validate and abort uploads if mismatches were detected — keeping junk data from entering the system.
- Trigger real-time alerts (via Slack) when anomalies were caught — like when a brand’s return amount didn’t reconcile — tagging the responsible POC and blocking the file until fixed. No more silent errors.
And we kept expanding the rules engine. For example:
- If a brand marked an order as returned, but the net merchandise value (NMV) matched the original order amount, that raised a red flag.
- Or if NMV was zero but no return was mentioned, it likely meant the brand’s data hadn’t been properly cleaned — or the POC missed something.
The staging layer didn’t just catch errors — it bought us time, confidence, and a way to scale sanity.
Step 3: Chunking Files and Processing in Parallel — Divide and Conquer
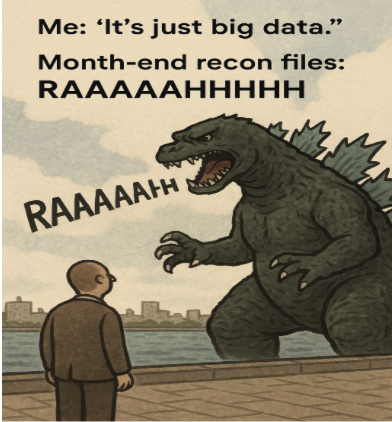
Month-end files were massive — multiple gigabytes and crores of orders flooding in at once. Loading everything at once? A guaranteed system crash.
Our solution was to break these giant files into smaller chunks and process them in parallel. Sounds simple, but here’s the catch: real brand data is messy. Some brands sent data by entire orders, others line items. Some included category tags or seller breakdowns.
We couldn’t just slice files anywhere — splitting an order across chunks meant double-processing and errors.
So, we built smart logic to keep every order, seller block, or category intact within a chunk. We even moved this chunking step to the frontend, giving us full control before the data hit our servers.
It wasn’t a flashy fix — but these small, careful safeguards saved us from chaos and kept our system running smoothly.
Step 4: Semaphore Locks — Keeping Our Sanity and Servers Intact
Handling massive data dumps wasn’t just a challenge for memory — it also pushed our database to its limits. Imagine writing details for 5 crore orders compressed into just 2–3 days. The CPU and memory usage would skyrocket during month-end, sending our monitoring dashboards into red alert mode and giving the team mini heart attacks on repeat.

During these spikes, we had to scramble — manually calling and messaging the team to please hold off on uploading files until the system calmed down. Our existing infrastructure was on the brink of collapse.
Now picture the chaos when, amid all this, one person accidentally uploads a file despite the warnings. The system load shoots exponentially, crashes happen, and chaos reigns.
Apart from that concurrency was still a challenge — because we handled 100+ brands, and file uploads were manual. Often, a single person managing multiple brands could accidentally upload the same file twice, putting heavy load on the system.
To fix this, we introduced smart semaphore locks — but with a twist.
We didn’t just block tasks outright. Instead, we built a dynamic queueing and retry mechanism that responded to system load in real time:
- If memory usage crossed a certain threshold, memory-heavy processes were paused and scheduled for retry after a cooldown.
- Similarly, if DB CPU spiked beyond a safe threshold, DB-heavy processes such as Sync & Show were deferred and retried after cooldown. (More on Sync & Show in the next section — it’s a crucial part of how we ensured data accuracy before going live.)
We even notified the uploader:
“Your file will be retried automatically in 5 minutes due to high system load.”
But here’s where things got tricky.
If the uploader didn’t see the message — or got impatient and re-uploaded the same file manually — both versions could get picked up together once the system stabilized, leading to duplicate processing and data discrepancies.
So we enforced a strict rule: Only one active process per brand at a time.
Even during retries, the system would lock at the brand level, ensuring no two processes could run concurrently for the same brand — manual or automatic. This prevented collisions, maintained consistency, and saved the team from another class of hard-to-debug issues.
No more waking up at 2 AM to find your jobs killed because the server threw in the towel.

Step 5: Sync and Show — Beyond Staging, The Real Quality Control Begins
Getting data into the staging table is just the beginning. Once the files land there, the real journey begins — a whirlwind of manual QC (quality control), validations, and judgment calls to catch anything that might throw reconciliation off track.
Spotting Anomalies Isn’t Optional — It’s Survival
This is where we dig deep to detect subtle and not-so-subtle anomalies. A few examples:
- Mismatch in GMV (Gross Merchant Value): The GMV we expect to reconcile doesn’t match what was reported. That’s an immediate red flag.
- Fraudulent patterns: Say a creator flagged as suspicious drives ₹15 lakh in sales in a single week. The brand reports that all of it was returned. Sure, returns happen — but 100% return on that scale? That’s not just bad luck; it demands investigation.
- Legit zero commission: Contrast that with a new creator who generates ₹250 in sales in their first month — and those few orders get returned. Result: zero commission. Same return rate as the fraud case above, but the context is completely different.
This is why business judgment matters just as much as technical validation. Both cases might look identical in raw data — but they mean wildly different things for payouts, fraud detection, and brand trust.
Historical Comparison Is Our Compass
Beyond individual anomalies, we also run pattern-based validations. For example:
- A brand POC (Point of contact) tells us their typical return rate is 20%. This month, it suddenly jumps to 30%.
- Even a 10% increase is enough to trigger a flag — especially when we expect just 2–5% variance month-over-month.
In such cases, we escalate back to the brand before proceeding.
Sync Isn’t the End — It’s the Final Checkpoint
Once data passes all these validations, we kick off the syncing process, which moves data from staging to production tables. But that doesn’t mean it’s immediately visible to creators.
There’s one more verification layer — a final checkpoint to ensure synced data is:
- Accurate
- Consistent
- Free from regression issues
Only after clearing this final gate do we show reconciled numbers to creators and trigger any downstream processes like payout generation.
Real Impact: From Heart Attacks to High Fives
Before these improvements, CPU usage would hit 99%, memory usage ballooned, and the whole system felt like a ticking time bomb every month-end.
After implementing chunking, semaphore locks, and smart monitoring:
- CPU and memory spikes flattened out.
- Tasks completed reliably without manual intervention.
- Our monitoring dashboards stopped flashing red alarms like an emergency room.
- And, most importantly, the team stopped having heart attacks every month-end.
Step 6: Alerts, Accountability, and Automation
By this point, we had a solid platform — but we still needed to catch errors early, ensure people were looped in, and make accountability traceable. That’s where our alerting and observability layer came in.
We embedded alerts throughout the process, not just at validation failures:
- When a file was uploaded, the uploader got an instant Slack confirmation — no more “did it go through?” guessing.
- Semaphore locks triggered alerts if uploads or syncs were blocked due to system load.
- If a validation failed, the relevant brand POC was tagged instantly with the reason and a direct link to review the issue.
But we didn’t stop at basic alerts. We knew validation needed to run on live, real-time data, but with large files, multiple environments, and time constraints, running heavy checks directly on the DB wasn’t scalable — even with optimization.
So, we built something better:
A dedicated analytics dashboard, powered by our data warehouse.
Every uploaded file got its own insights page:
- Linked directly in Slack alerts
- Visualized all key metrics, anomalies, and failure points
- Tagged both the uploader and the brand’s QC manager
This meant anyone could inspect a file’s health at a glance — without touching raw tables or relying on engineers.
And we extended this visibility to Sync & Show as well:
- When a brand’s data was synced, the uploader and stakeholders were tagged automatically.
- This ensured that everyone knew what had gone live, and when — closing the loop across tech, ops, and finance.
Automation still wasn’t perfect — and some manual QC remained — but this system drastically reduced human error, improved visibility, and helped us move faster with confidence.
Part 2 Recap: The Fortress We Built
Sale Reconciliation Is Like Menstruation: A Brutally Honest Analogy
- ✅ It comes every month, uninvited
And no matter how prepared you think you are… it still wrecks your week. - 🕓 You can track it, but you can’t always predict the mood swings
Sometimes it’s early, sometimes late. Sometimes light, sometimes it’s a full-blown data hemorrhage. - 🩹 You’ve got pads (staging tables) and painkillers (semaphore locks)
But you still end up crying with a hot water bottle (or a Jupyter notebook). - 😶🌫️ The week before is worse than the actual event
Pre-reco anxiety hits harder than production errors. - 🔁 It’s cyclical, painful, and ignored by leadership until it breaks something
And when it does break? Everyone suddenly wants to know where the file is.
From manual uploads and crashing scripts to an admin panel, staging area, chunked parallel processing, semaphore locks, and rich data models — this was our fortress.
It wasn’t perfect, but it was stable, scalable, and most importantly, stopped the servers from dying on month-end.
Next, I’ll share how we tackled the tricky world of order statuses, commission structures, and built a state machine that kept everything in line — plus the chaos of adjustments and mismatches we had to handle.
Stay tuned. The fortress is built, but the battle isn’t over yet.